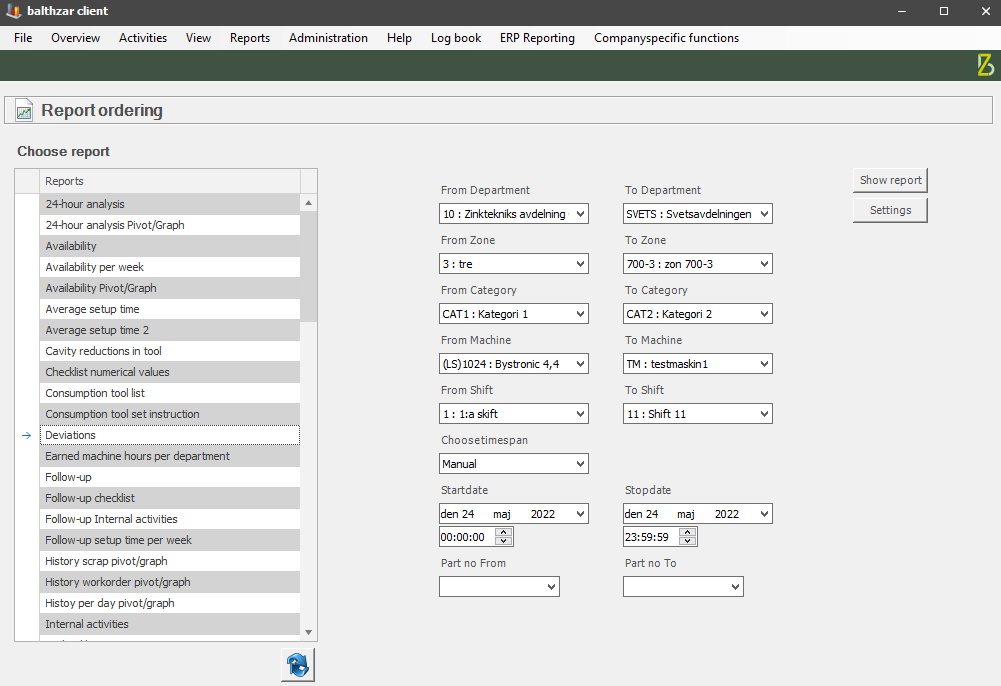
This report will show the number of errors/deviations which has occured during a certain time period. Please note that this need special function 20 register deviation frequency . See the pictures below for how it can look like in Client, as well as how data from the report viewer can be presented.
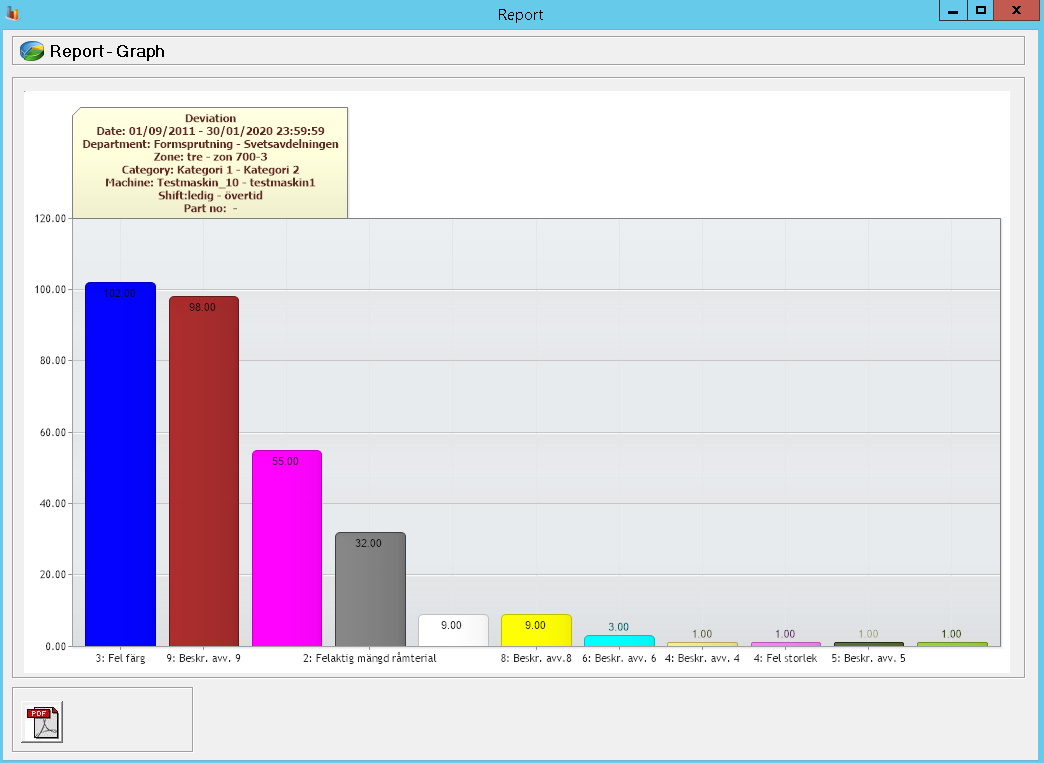
It is important to know that in the graph below the staples will be shown in falling order based on number of deviations. The reason behind this, is to make it easier to see where the deviations has occured, and where you need to make changes to gain maximum effect.