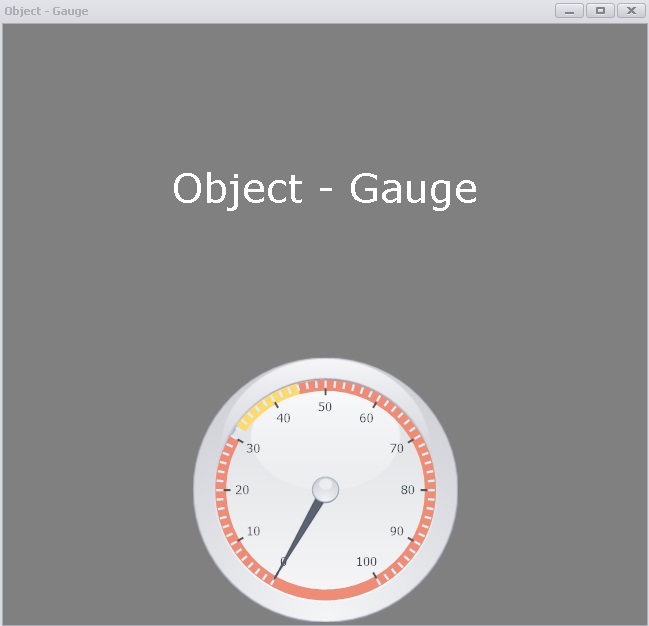
It is possible to add a gauge object to the dashboard. A gauge object can for example look as below.
A gauge object is a gauge which receives data from an SQL query and shows that data in a gauge. The data query must return a one column one row answer.
If you are editing the dashboard and if you are the owner of the gauge you have
access to a setting's window. To access this you can right click in
the gauge object window. You can see the setting's you can change
below.
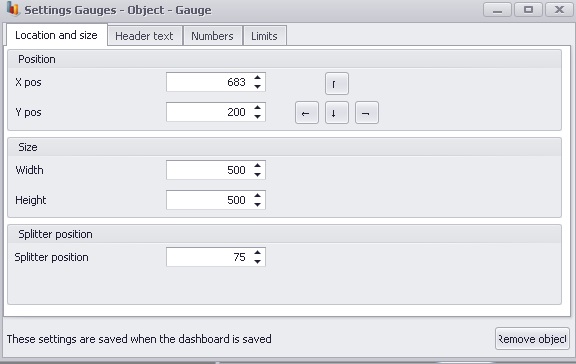
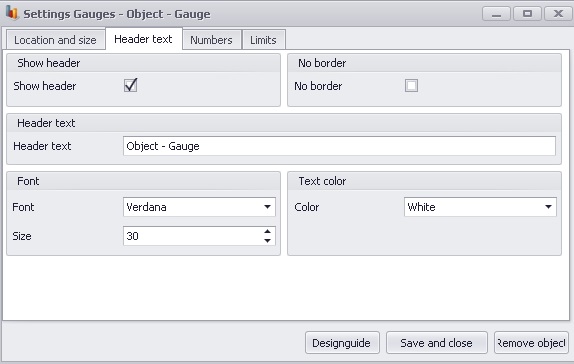
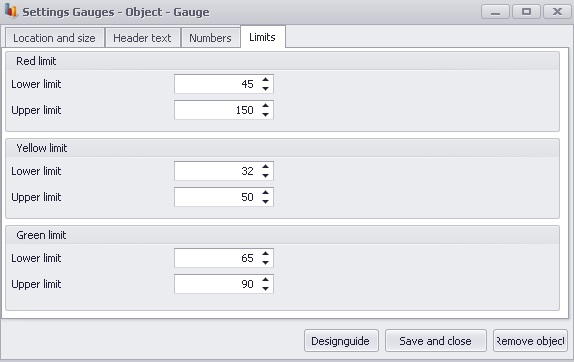
In "location and size" you can change the objects location and size. In "header and text" you can change the obects font, fontsize and fontcolor and if it should have a border or not. In "numbers" and "limits" you can see the setting's below:
Green range
start
The value that the green area should start at.
Green range end
The value that the green area should end
at. (Between green range start and green range end a green field will
be shown, se image above between 0 and 5).
Yellow range
start
The value that the yellow area
should start at.
Yellow
range end
The value that the yellow area
should end at. (Between yellow range start and yellow range end a yellow
field will be shown, se image above between 7 and 13).
Red range start
The value that the red area
should start at.
Red range end
The value that the red area should
end at. (Between red range start and red range end a red field will be
shown, se image above between 7 and 13).
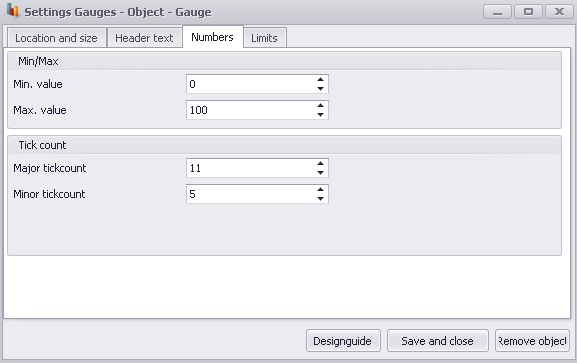
Major tick count
How many "major tick
counts" that should exist in the gauge. A major tick count are the
places on the gauge where the values are writen out (0, 5, 10, 15 and 20 in
the image above (5 major tick counts)).
Minor tick count
How many "minor tick
counts" that should exist in the gauge. A minor tick count determines
how many minor ticks there should be on the gauge between each major tick.
(In the image above the pointer is pointing at a minor tick).
Min. value
The min value that the gauge can
show. (Any value that is lower than this will be shown as this value).
Max. value
The max value that the gauge can show. (Any value that is
higher than this will be shown as this value).
If the button "Designguide" is pressed a new window is opened where it is possible to make some graphical adjustments to the gauge. To save the settings, press the "Save layout" button.