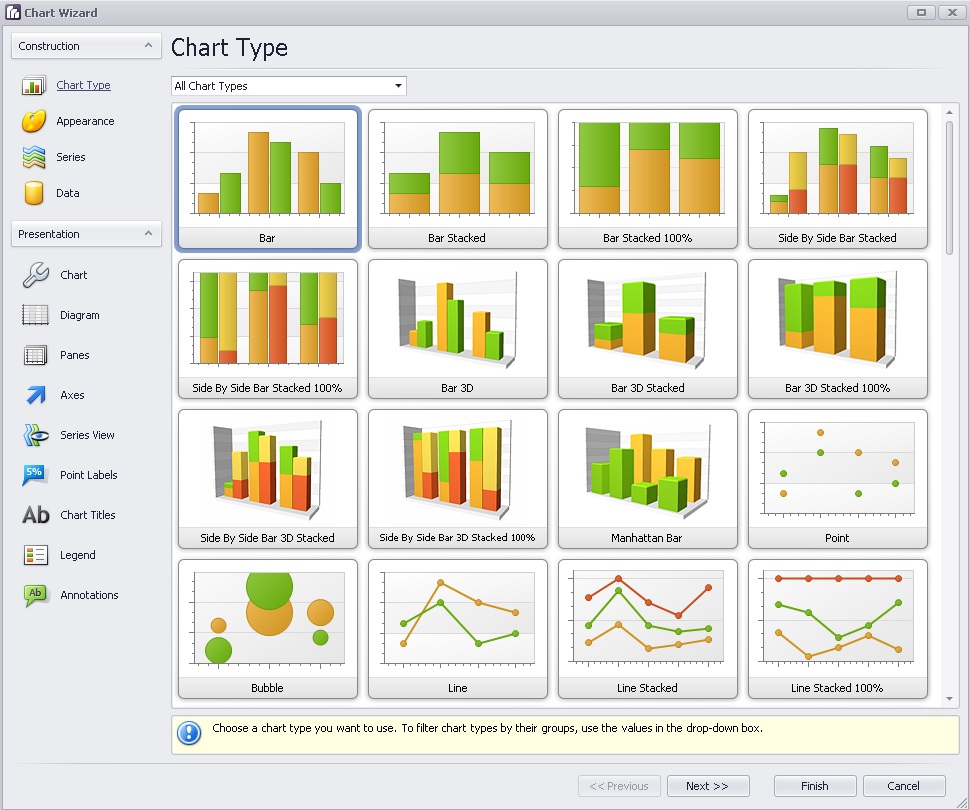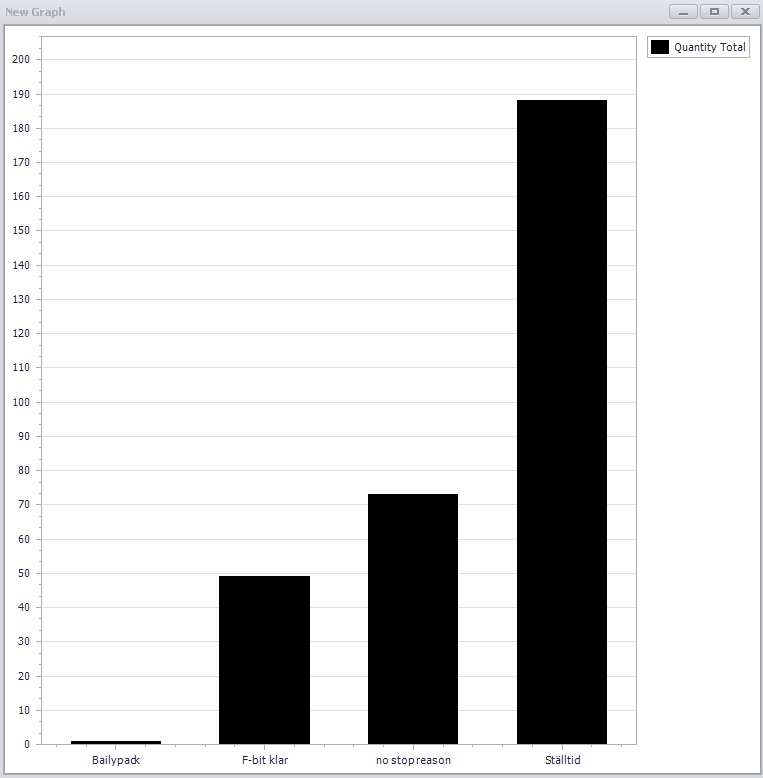
It is possible to add pivot graphs to your dashboards. A graph can for example look as bleow.
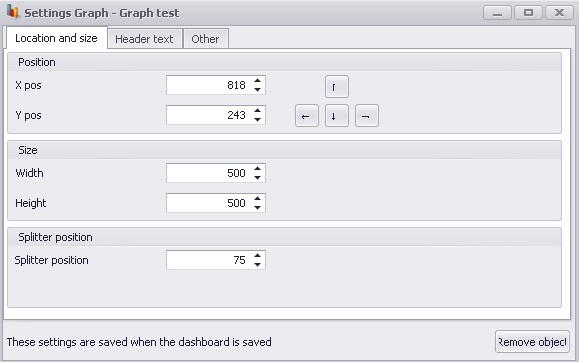
If you are editing a dashboard and have created the graph you have access to a setting's window. To open the setting's window, right click in the graph object window. You can see the setting's window's below.
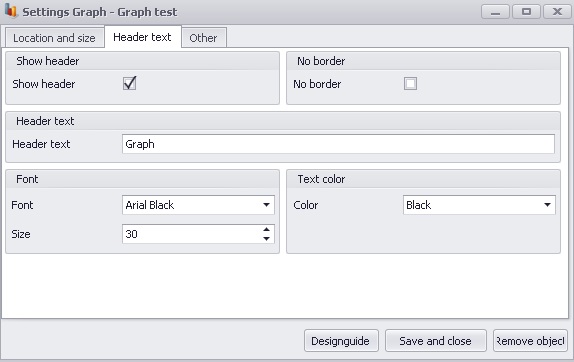
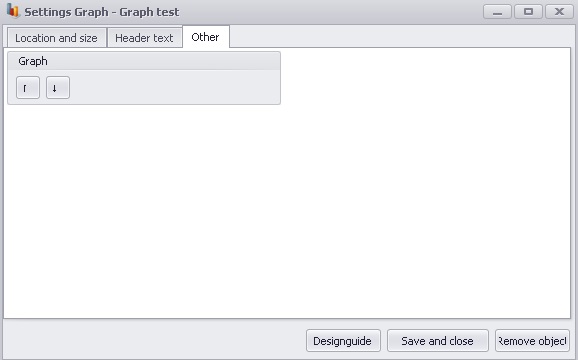
If you press "Designguide" a new window is opened where a few graphical changes can be made to the graf. It can for example be changed to a circle diagram. If the up or down buttons are pressed the pivot grid for the chart is shown or hiden. It can for example look as below. For more information about the pivot chart, see report viewer