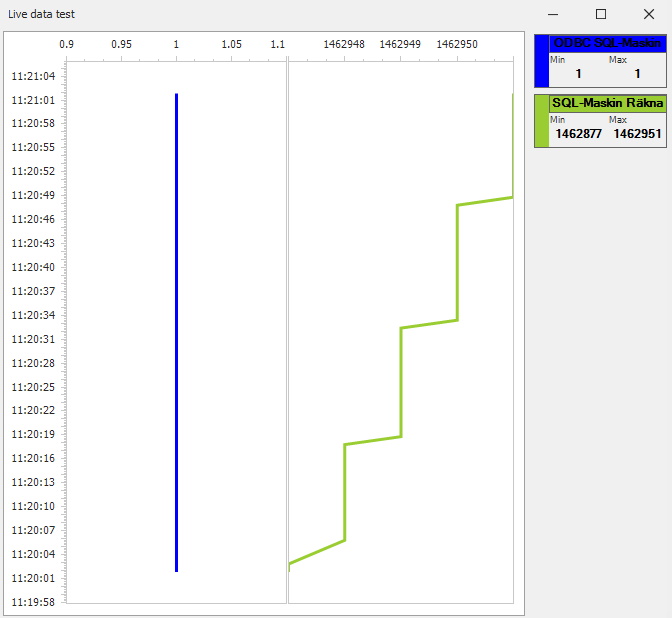
If you are the owner to the Dashboard you can add an object called "Live data" via the "Object adder" menu. You can reach this menu via the shortcut "Ctrl + M". This object is a bit different compared to the other Dashboard objects since this one has some more settings. You can see an example of how this cobject might look like in the Dashboard below.
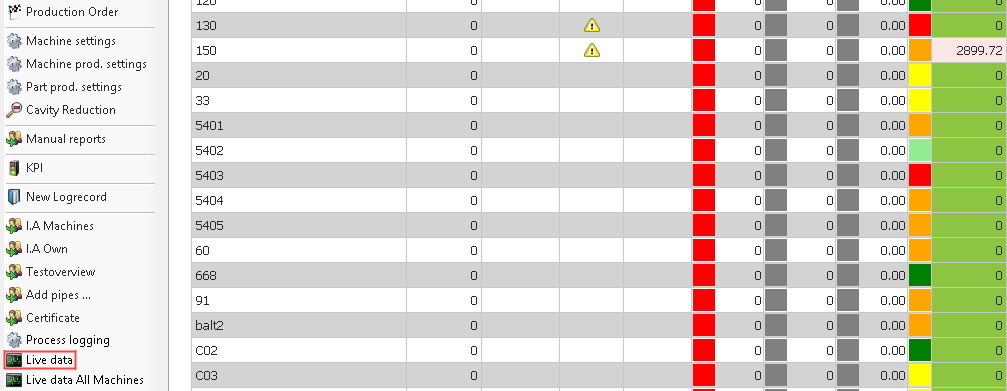
The data shown in the example above is depending on what machine you have selected in the "Overview" menu in "Client" as well as what SQL query you have selected when you created the object in the "Object adder" menu. It is also possible to fetch the data seen above directly from "Client" via the left side menu option called "Live Data", see picture below.
As stated earlier this object is a bit different due to the fact that it has more options to change the objects settings. See picture of that menu as well as explanations below.
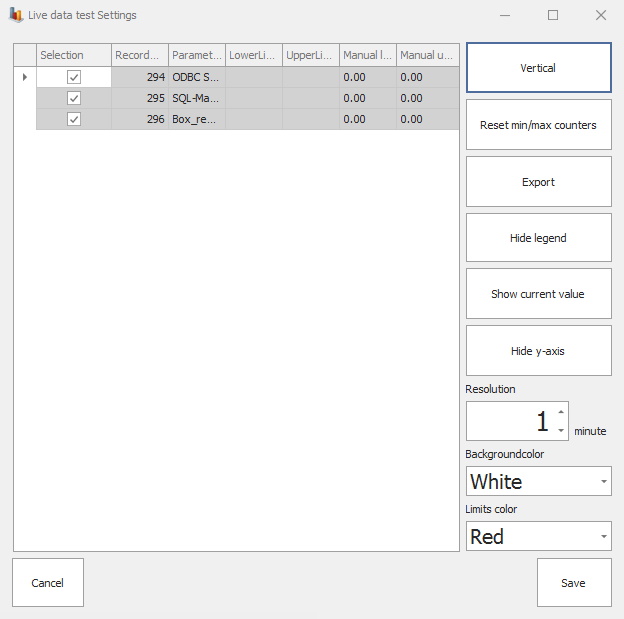
Horizontal/Vertical
Here you can decide if you
wish the graph to be horizontal or vertical, this can be changed as many times
as you wish.
Reset min/max
counters
Here
you can choose if you wish to reset the min/max counters or not.
Export
Here you can choose
to export the current values as a PDF file. If you choose to do this you first
have to save the object as a PDF on the computer and then you
can search for it and export it via email.
Hide/Show
legend
Here you can either show or hide two boxes
with info about min/max values from either ODBC SQL machine or SQL
machine.
Show min/max or Show
current value
Here you can choose to either show a min/max
value in the boxes mentioned above or show the current
value.
Hide/Show Y
axis
Let's you either hide or show the y axis in the table for live
data.
Resolution
Here you can use the arrows to the change the resolution in real
time for the live data window.
Background
color
Here you can change the background color of the live data
table. Please keep in mind that it should be a color that makes it easy to
see the data presented in the window.
Limits
color
Here you can change the color of the limits in the live data
table. Please keep in mind that it should be a color that makes it easy to see
the limits presented in the live data table window.
Cancel
If you wish to cancel any/all changes
click this button and then return to the dashboard main window.
Save
If you wish to save any/all changes click
this button and then return to the dashbaord main window.
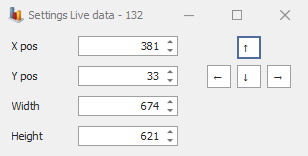
There is one last menu option to go through for this object. You can see a picture of that menu below and as you can see you can change the objects position and size here.