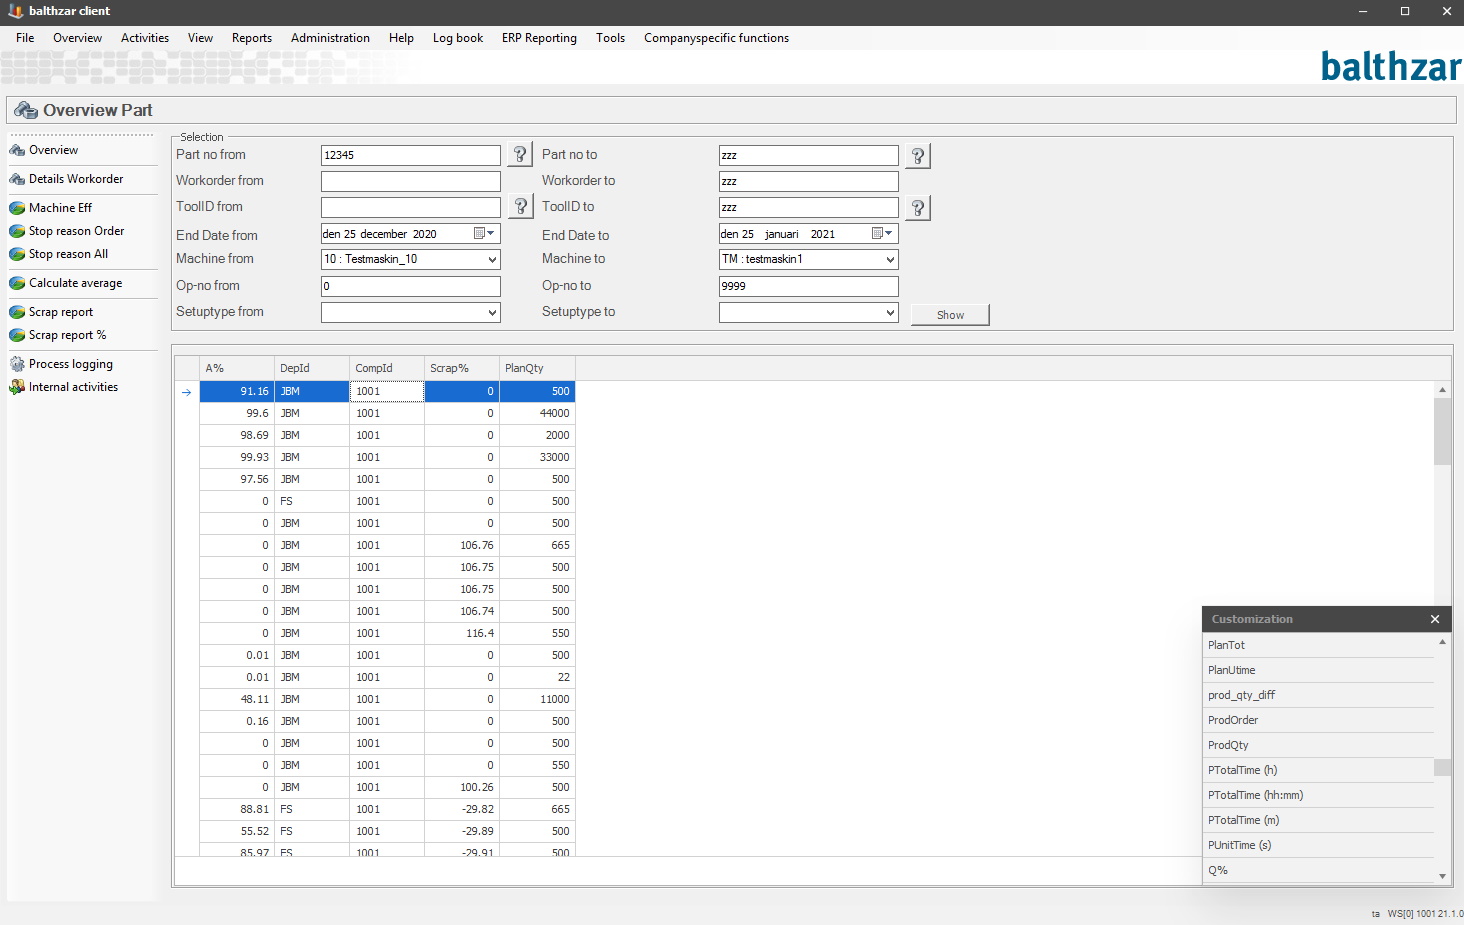
The form "Parts 2" is used to review details of orders which are ended within a timespan. The menu to the left is used to show additional information about the selected workorders, for more information about each menu please see the corresponding section in the documentation. When you have selected a workorder and clicked on "Show" you can then customize the data shown via Balthzar Client's grid system. You simply select one option you wish to show from the customize table and then drag it to the form in order to view it's available data. In the picture below you can see an example of how it might look like.
Menu options
Overview
Displays the screen shown above.
Details workorder
Displays detailed information about a selected workorder, shown in
a separate form.
Machine
Eff
Displays a separate chart showing machine effeciency.
Stopreason order
Displays a chart of stopreasons which have been used during the run
of the order during production time and their respective times.
Stopreason
All
Displays a chart of all stopreasons used, regardless of
production time, during the time of an order.
Calculate average
When the values of the OEE is calculated, each sub value
(O/E/E) is calculated separately. When the same numbers are calcuated for a
selection of orders, all selected orders are considered as part of a larger order. Meaning
that the same calculations are made, but ALL data from each workorder is added in
a single calculation. This make long runs affect the total more and short ones,
less.
As a way to demonstrate a simplfied example of this, consider the following:
An average of two workorders which have very different properties, as explained below.
Order
1
Run time: 45 minutes (2700 seconds).
Stop
time: 30 minutes (1800 seconds ).
Order
2
Run time: 20 hours (72 000 seconds).
Stop time: 2 hours (7 200
seconds).
Now, if you would calculate
the availability of theese two orders, the result would be:
(Using this
formula: Run time / (run time + stop time).
Order 1: 2700 / (2700 + 1800)
= 2700 / 4500 = 0.6 = 60%.
Order 2: 72000 / (72000 + 7200) = 72000 / 79200 =
0.9091 = 90%.
In order to calculate an
average between the two orders above you cannot do that by simply adding (60 +
90) / 2 = 75%.
The reason for this being the huge difference between
the two orders in run time and stop time.
The correct way would rather be to summarize each orders time in regards to their relevance and use the original formula as in:
(Run time order 1 + Run time order 2) / (2700 + 72000 + 1800 +7200) = 74700 / 83700 = 0.8924731182795699 = 90%.
The same principle is applied when calculating the other sub values of the total OEE value.
Explanation for
formula
[O]EE
Run time / (Run time + stop time).
O[E]E
Planned time per piece / real time per piece.
OE[E]
100
- (Scrapped quantity / (good quantity + scrapped quantity) *
100).
Scrap report
Displays various graphs which will show scrap data.
Scrap report %
Displays various graphs which will show scrap data %.
Process
logging
Displays a separate chart which will show you data for
process logging.
Internal activity
Displays information about internal activity for this specific work
order.