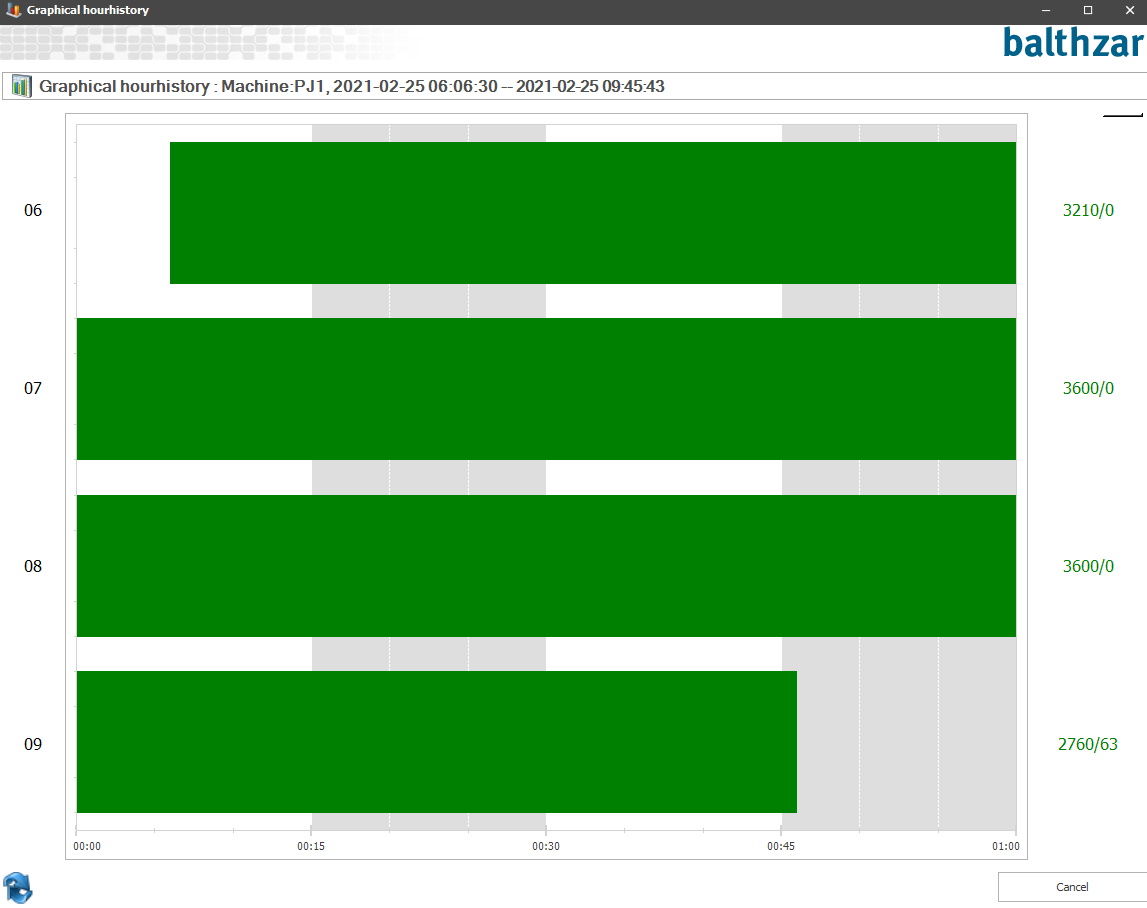
Here you can see the distribution of elapsed time regarding stop time and run time for the submenu "Current shift". To see something here you first have to select an active machine in the "Overview" menu in "Client". Each hour bar represents this hour distribution of stop time and run time by showing part of the bar with the stop reason color, or with the color green if it displays run time. To interpret what is shown in the graphs it is important to know that the numbers on the left side represent the current hour, and the numbers on the right side represent production values.
In our example below, you can see that the first staple represents hour six (6), and 3210/0 means 3210 registred cycles and 0 is the current production value for production. Please note that it is important to know the whole story behind these numbers. If for example, you have zero registered cycles that might not have to be a bad thing. The reason for this might be that the selected machine might have registered this over a weekend, or maybe there has been some kind of stop reason active or the machine had to go through service during this time. It is also important to point out that what is considered to be good/bad numbers can differ a lot from one company to another.