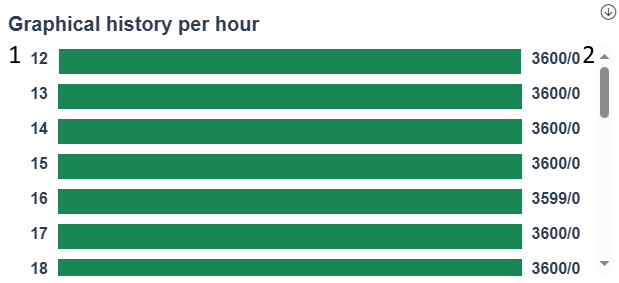
The function "Graphical history by hour" can be found via the "Left side menu" in "Client" and displays the distribution of past time for stop time and run time. To see anything in the available submenus you need to choose an active machine in the "Overview". Each submenu has its own documentation to make it easier to find the information you are looking for. It is also important to know that each submenus graph's timestamps are not based on the standard 24h format. Instead, they are based on a selected time interval (day/shift) per hour for the selected machine. In the graphs, you will see what hour it is when you look at the numbers to the left. When you look at the numbers to the right you will see production values. There are two different production values calculated here, and they use the following formulas: cycle value: cycles * cycle recalc factor, and production goal: (run time + stop time) * OEE green limit/planned cycle time.
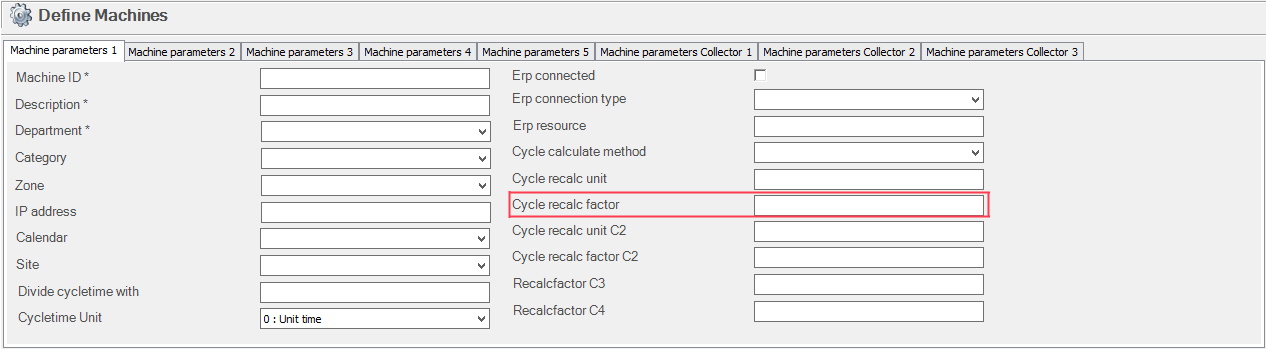
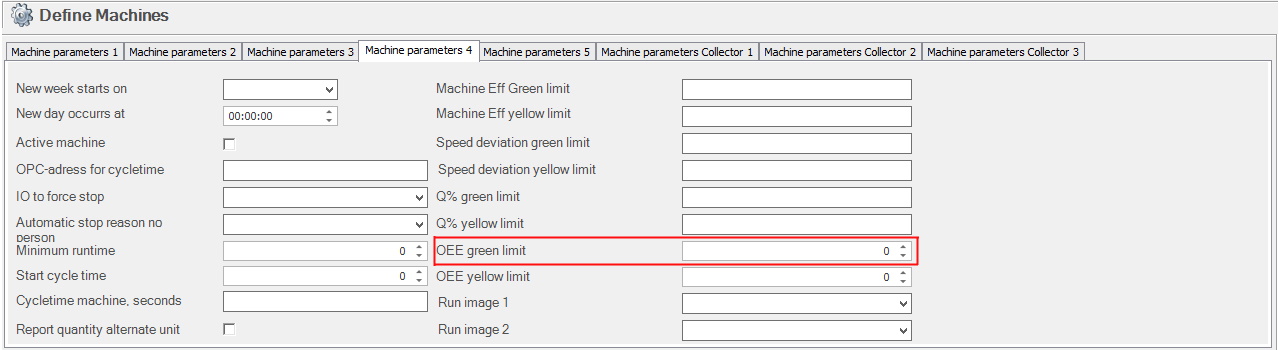
To set this up you also have to activate "Cycle recalc unit" in "Machine parameters 1" and "OEE Green limit" in "Machine parameters 4" you can find these settings via "Client" -> "Administration" -> "System settings" -> "Basic data" -> "Machines". See the pictures below. Planned cycle time is taken from the order active at the time. If there is no active order at the time the production goal value will always be zero (0).
As stated above this function is used in the Client, but can also be used in BZX21. See an example of it below. To the right, 1, represent the actual hour. To the left, 2 represent the cycle value / production goal.
Current
shift
Previous
shift
Today
Yesterday