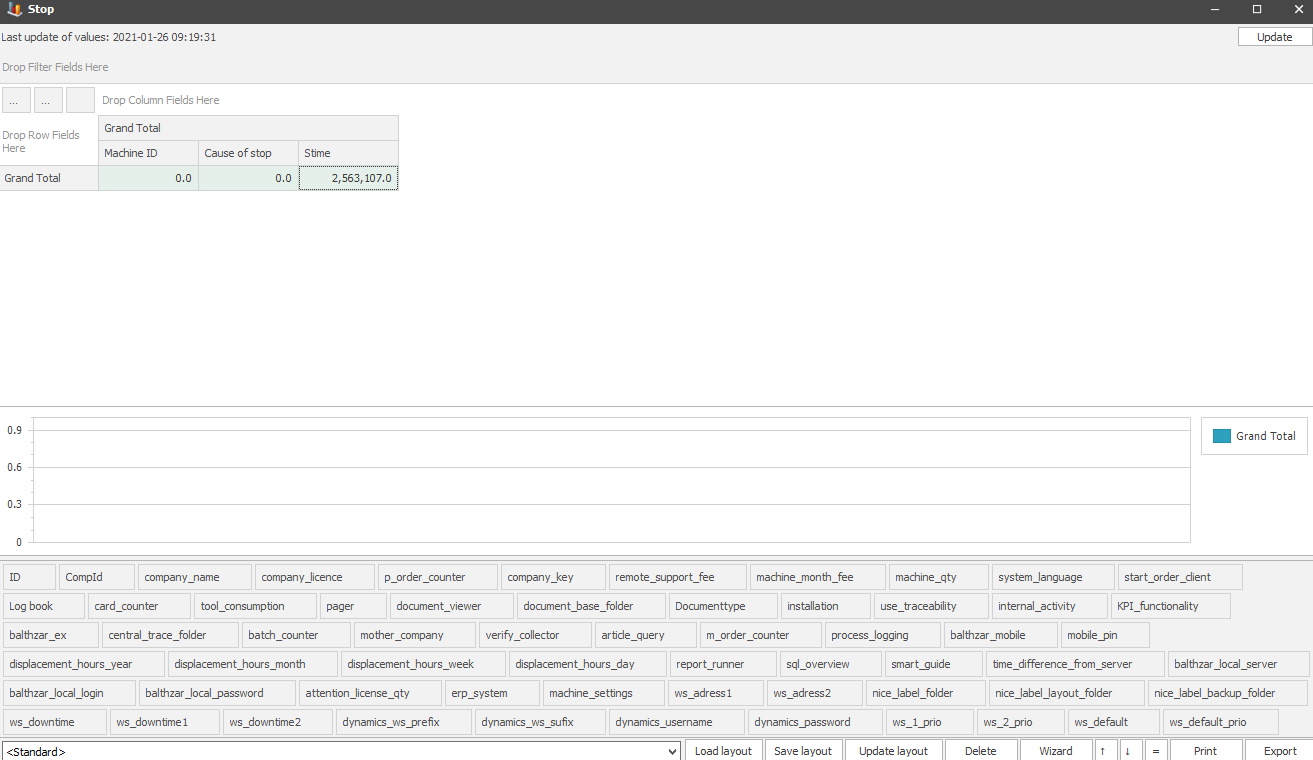
With this option, it is possible to show a pivot grid as well as a graph. You can find this menu via "Client - "> "Overview -" > "Own pivot + graph". To create a new one, click on the edit button, and then an SQL overview menu will appear. Here you can select two SQL queries that will control what is shown in this overview.
Depending on what SQL queries you select, this overview can show everything from pictures, dates, schedules, graphs, and more. You can read more about how SQL queries work here and the form to administer SQL queries can be found via "Client" -> "Administration" -> "System settings" -> "Basic data" -> "SQL queries". You can see pictures of the SQL overview and the overview itself below. Here there is more information about how tags works in own pivot + graph.
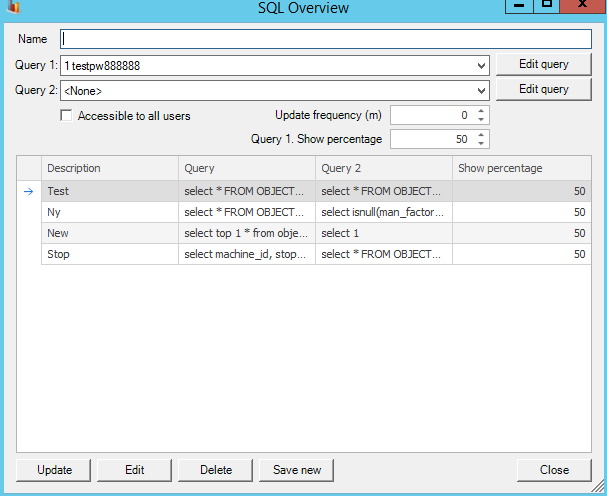
Name
The
name of the SQL Query.
Query
1/2
In Pivot + Graph it is possible to use two SQL Queries.
Accessible to all
users
If this checkbox is activated, all users will have acess to
this. However, it if it not activated, it will only be visibile to the creator.
Update frequency
(m)
Enter the number of miniutes that the SQL Query/s should be
updated here. For example, if you enter 10 here, then an update will
happen every 10th minute.
Query 1 Show
percantage
This determines how much of the Overview that will be
either a Pivot, or a Graph. For example, enter 50 here, then the
Overview will be show 50% Pivot, and 50% Graph.