The idea behind this report, OEE - Data 2, is the same as the previous report OEE - Data, which was to show OEE related date based on essential terms. The Report OEE - Data 2 is a follow up to the original OEE - Data report and therefore you will see that it has many common attributes and settings.
Please note that all future development will be focused on OEE - Data 2 report.
In this report you have a number of different groupingterms to choose from. You can see more information about each option below.
Department
Zone
Category
Machine
Shift
Timespan
Tool
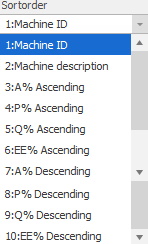
Sortorder
Here you
can select an option for which the report will be sorted
on. Currently you can choose one of the following options. Machine ID,
Machine description, A% Ascending, P% Ascending, Q% Ascending, OEE% Ascending,
A% Descending, P% Descending, Q% Descending, OEE% Descending. See the picture
below.
Grouping term
Here you can choose between different options which
will determine what grouping term the report should be based on. For
example
Drilldown
shifts
If you tick this box the report will be divided per
shift, each machine will get one row per shift. Machine ID, Tool
ID, Part ID etc.
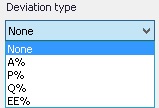
Deviation type
A set of
terms that can further limit the values of
the report related to the values of O%, E%, E%, or OEE%.
Lowest/Highest allowed
The timespan in which the choosen deviation type
should be within.
From/To
availability level
The specific interval of availability levels
which should be a part of the report. To edit levels go to "Client" ->
"Administration" -> "System settings" -> "Basic data" -> "Stop reason"
-> "Stop reason 2" -> "Availability level". Here
there
is more information about how it works.
Part
number From/To
The specific parts which should be included in the
report.
Show extra
information
If you tick this box four more
columns will be added to the report and they are: "Turn-out quantity", "Target
quantity", "Diff quantity" and "Diff
time".
OEE%
24/7
This tickbox will change how the report will calculate the OEE% value. With this
activated it will calculate the OEE% value as O0%*E%*E%, instead of the
standard version which is O%*E%*E%
Machines
A drop down menu where you can select what
machines you want to be included in the report. Please note that if these
machines are somehow excluded in any of the other selections they will not be
selected here no matter if you choose them or not.
The difference
between the options "Select All", and "All" is that "Select all" will only include
all machines that exists when the choice is done. If any new/future machines should
be included automatically the option "All" has to be selected.
Min order time in hours
This is the
time which the current running order has been up and
running. If this selection is part from 0 we will only take data for the orders which are currently
up and running as well as the orders which have been running for x hours.
You can set the value manually or use the arrows to reach the desired
value.
Layout
Here you can choose to either use the
standard layout or go for your own version. You can reach the design guide if
you click the plus sign. You can also choose between available designs in the
drop down menu. There is more information about the report design guide here.
P%
max 100
If
this tickbox is selected the calculation of P% is corrected so
that even if the actual value of P% is above 100 the system will
correct it to 100. This is true regardless of which choice
of groupingterm is selected. For example, if Departments are
selected as grouping term then the departments P can't go over 100%,
or if you choose to group on machines the selected machines P can't go over
100%.
Availability levels
In this drop-down menu you can select different
availability levels for this report. This can be edited via "Client" ->
"Administration" -> "System settings" -> "Basic data" -> "Stop reason"
-> "Stop reason 2" -> "Availability level". Here
there is more information about how that form works. For
this to work as intended the selected levels has to be within from the
value as well as to the value, AND within the selection.
You can choose if you only wish to display these values or "OEE" values which are greater than or smaller than a certain value. To set this up you can choose a "deviation type" and enter values in the "lowest allowed" and "highest allowed" menus. Please note that as standard the system will choose the option "None" here. This means that the user have to make an active choice here in order to see any related information when viewing the report. The letters stand for:
A%
Availability in % is calculated run
time / (run time + stop time).
P%
Performance in % is calculated
earned hours / (earned hours + scrap prod time / run time).
Q%
Quality in % is calculated earned
hours / (earned hours + scrap prod time).
OEE%
This term stands for Overall Equipment Efficiency and is a summary of previous
parts and will show you an overview of the selected machine. Is calculated A*P*Q
(Availability * Performance * Quality).
Exclude line
children
If this checkbox is activated, then only the
machines designated line parents will be visible in the report viewer. Machines designed line
children will be excluded.
To set up new/edit old machine lines go to "Client" -> "Administration" -> "System settings" -> "Basic data" -> "Line". Here there is more information on how that works.
However, machines that are not included in machine lines will be visibile in the report viewer regardless of this checkbox status.
Create sub
total
Here the selection will be based on
which overview that is selected. There are four options
here: None/Category/Department/Zone. For example, if Department is selected, it will have its own section in the report viewer called Department.
To create
new/edit existing overviews go to "Client" -> "Main menu" ->
"Overview". Here there is more information
on how this works.
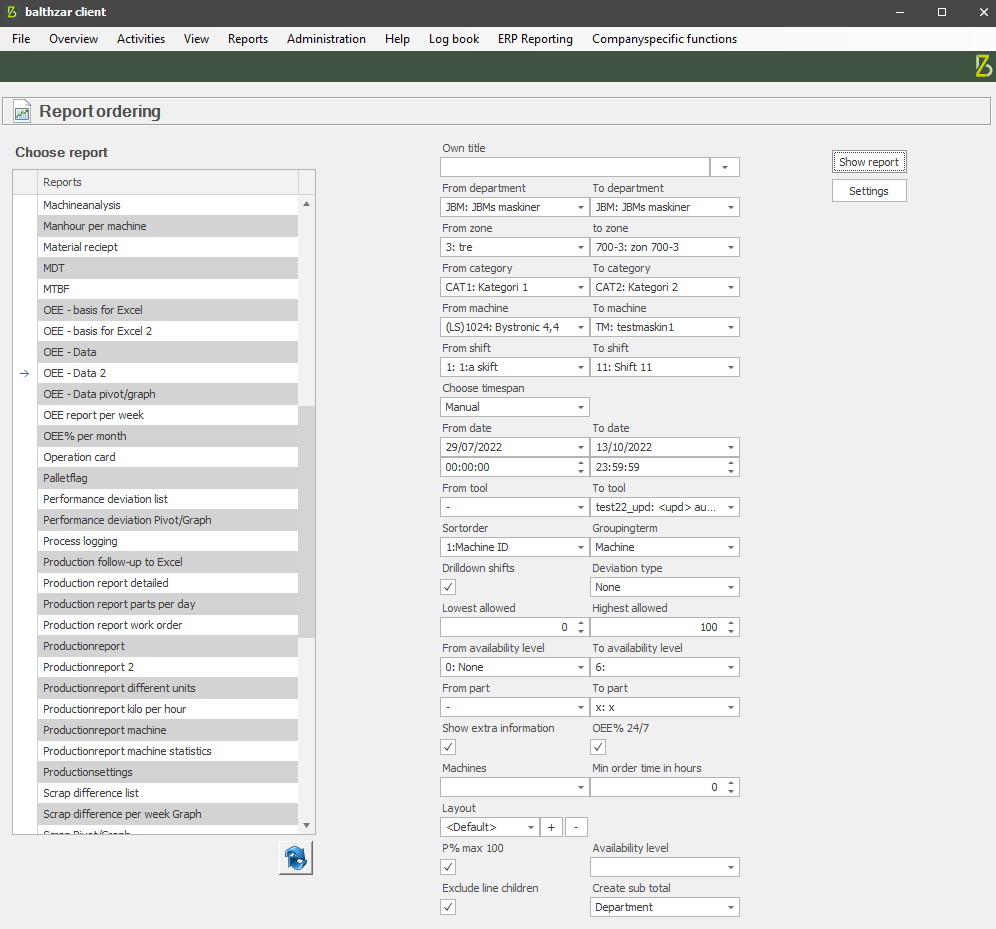
Below you can see what the selection in Client looks like, as well as an example of how the report will look like in the report viewer. Please note that the checkbox called "Show extra information" is active.
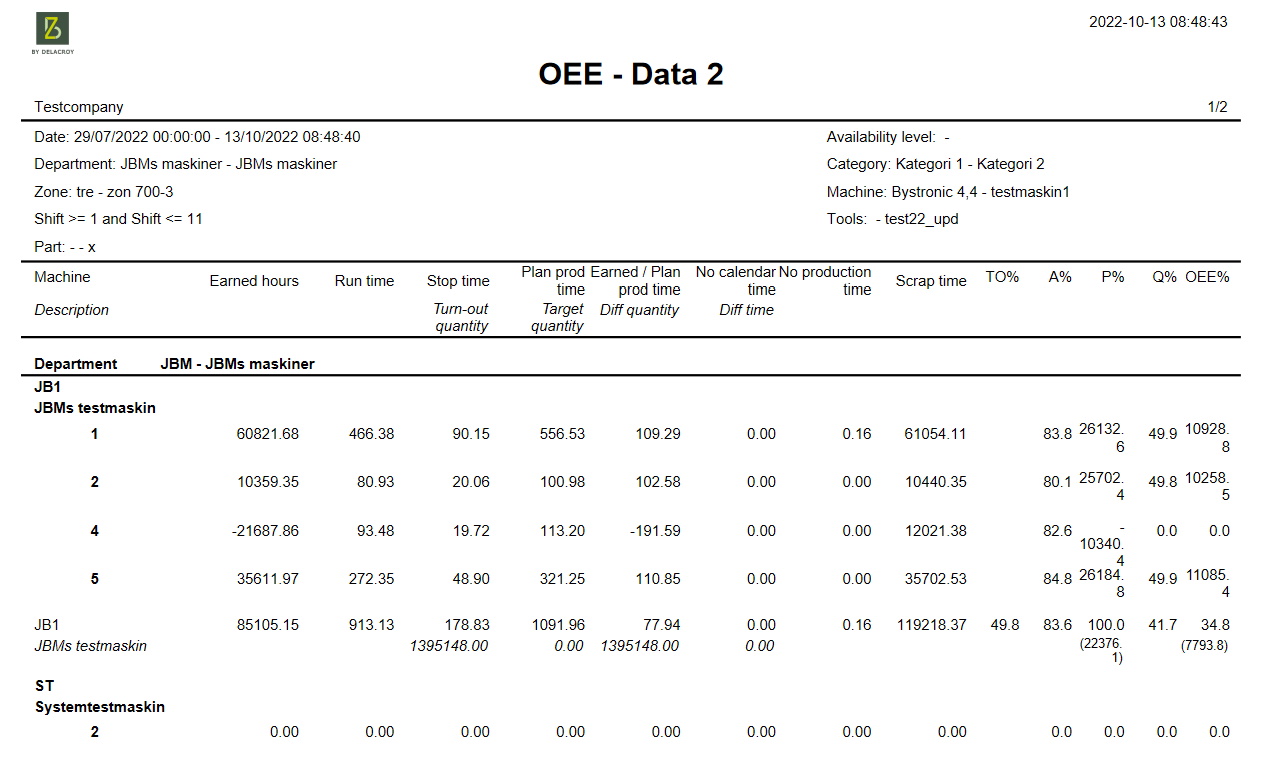
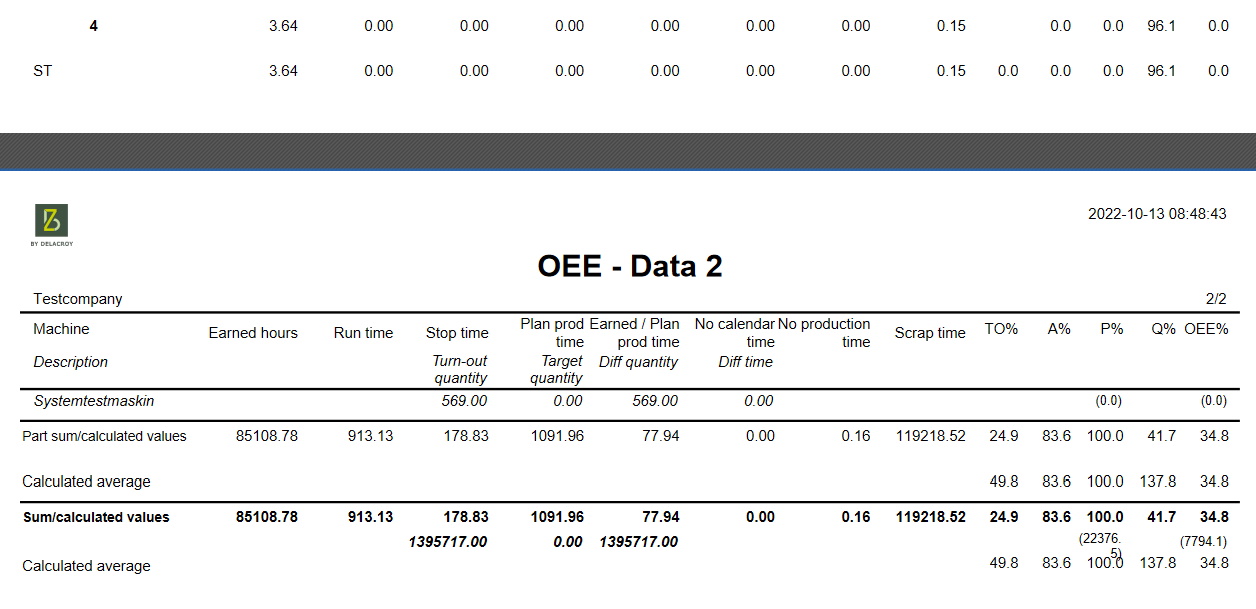
It is important to note that after each machine's data is shown there is also a row for a summary for each machine and this will not be included in the final summary. Below you will find an explanation for the columns shown in the report.
Earned
hours
Is calculated as Approved produced quantity * planned set up
time.
Run
time
Here you will see data for the machines
run time.
P% loss
stop
If the stop reason has the flag "Speed loss" assigned to
it it will be listed here. This stop time will NOT appear in the column for stop
time. These stops will not affect the availability (A%) but will
instead affect productivity (P%).
Stop
time
The machine has been still during calendar time, stop
reasons which are not "production time" are excluded.
Turn out quantity
How many
products the machine has produced. This will be calculated as: cycles *
(reductions - cavity reductions) * realcalculationsfactor.
The following SQL
query will be made:
CASE dbo.object_machines order_qty_calc
WHEN 3 THEN 0
ELSE ISNULL
(dbo.object_transaction.cycles.0)*(ISNull(dbo.object_work_order.insatser.1)-
ISNULL(dbo.object_work_order.cavity_reduction,0))*
ISNULL(dbo.object_machines.cycle_recalc_factor,1 )END AS
produced_qty
Plan prod
time
The time which the machine is planned to be running an order.
Is calculated as run time + stop time.
Target quantity
How many
products the machine should have produced if it had run as planned. This
will be calculated as: (runtime + stoptime) * timedistribution * capacityfactor
* planned cycle time.
The following SQL query will be made:
CASE
object_machines.cycle_time_unit WHEN 0 THEN
CASE
isnull(dbo.object_stop_reasons.production_time,N'yes) when N'yes' then
case isnull(dbo.object_transaction.shift, 0) when 0 then 0
else
case isnull(dbo.object_work_order.plan_cycle_time,
1) when 0 then 0
else (dbo.object_transaction.run_time +
dbo.object_transaction_stop_time) *
CAST(ISNULL(dbo.object_work_order.time_share, 1) AS float) *
ISNULL(dbo.object_work_order.capacity_factor,0) /
ISNULL(dbo.object_work_order.plan_cycle_time, 1) end
end
else 0 end
ELSE 0 END AS target_qty
Earned / Plan prod
time
This is calculated as Earned hours / plan prod time.
Diff quantity
Shows how much time that is earned/lost depending on the diff
quantity if the machine had run at the target speed.
At the last column in the report, a sum is shown. However, in the case of OEE%, this is not a sum of the values above, rather a calculated sum based on all values the report takes into account for the A%, P% and Q% terms.
No calendar
time
No calendar time is time for when the machine has been active
outside the designated calendar time.
Diff time
Here you will see the difference in time between diff quantity and
diff target. If the machine was running at target speed.
No production
time
No production time is time for when the machine has been
stopped with a stop reason which has "no production time".
Scrap production
time
Scrap production time is calculated as scrapped quantity *
planned time per piece.
TO%
Here you will see data for availability
based on all the time for the selected interval. Please note that there
is no consideration taken regarding calendars or any other related information.
A%
Here
you will see data for availability (A%) and this is calculated as runtime /
(runtime + stop time).
P%
Here
you will see data for productivity (P%) and this is calculated as (earned hours
+ srap prod time) + runtime + P% loss stop).
Q%
Here
you will see data for quality (Q%) and this is calculated as (100 - (scrap
quantity / (Prime quantity + scrap quantity) *100).
OEE%
This
term stands for Overall Equipment Efficiency and is a summary of previous
parts and will show you an overview of the selected machine. Is calculated A*P*Q
(Availability * Performance * Quality).