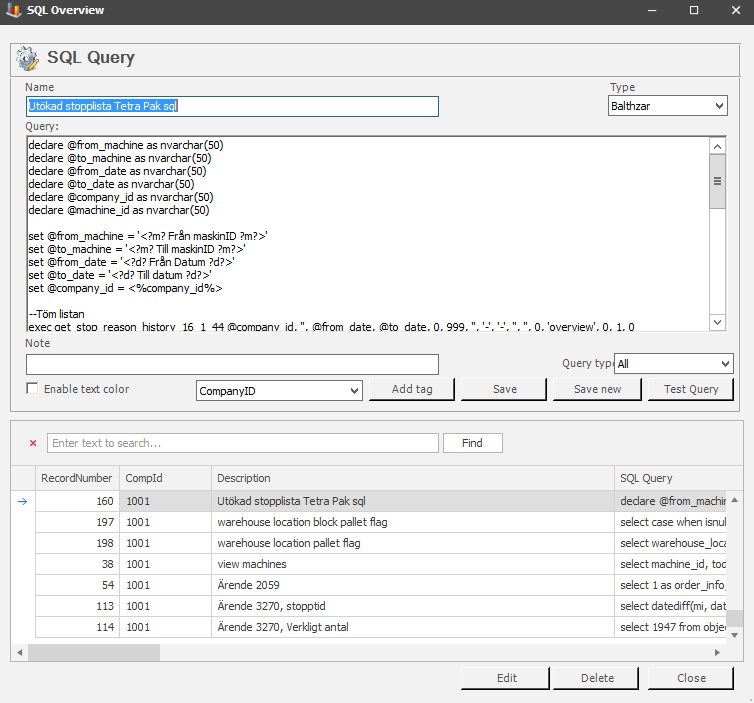
Via the main menu in "Client" -> "Overview" you will find the sub menu called "Own Pivot/Graph". The function "Own Pivot/Graph" is similar to "Own overview". Here custom made SQL queries will control the content visible in the forms. You will edit/create/add/save SQL queries in the "Edit" menu.Based on the data generated from theese SQL queries you can then create you're own Pivot/Graph in Balthzar Client.
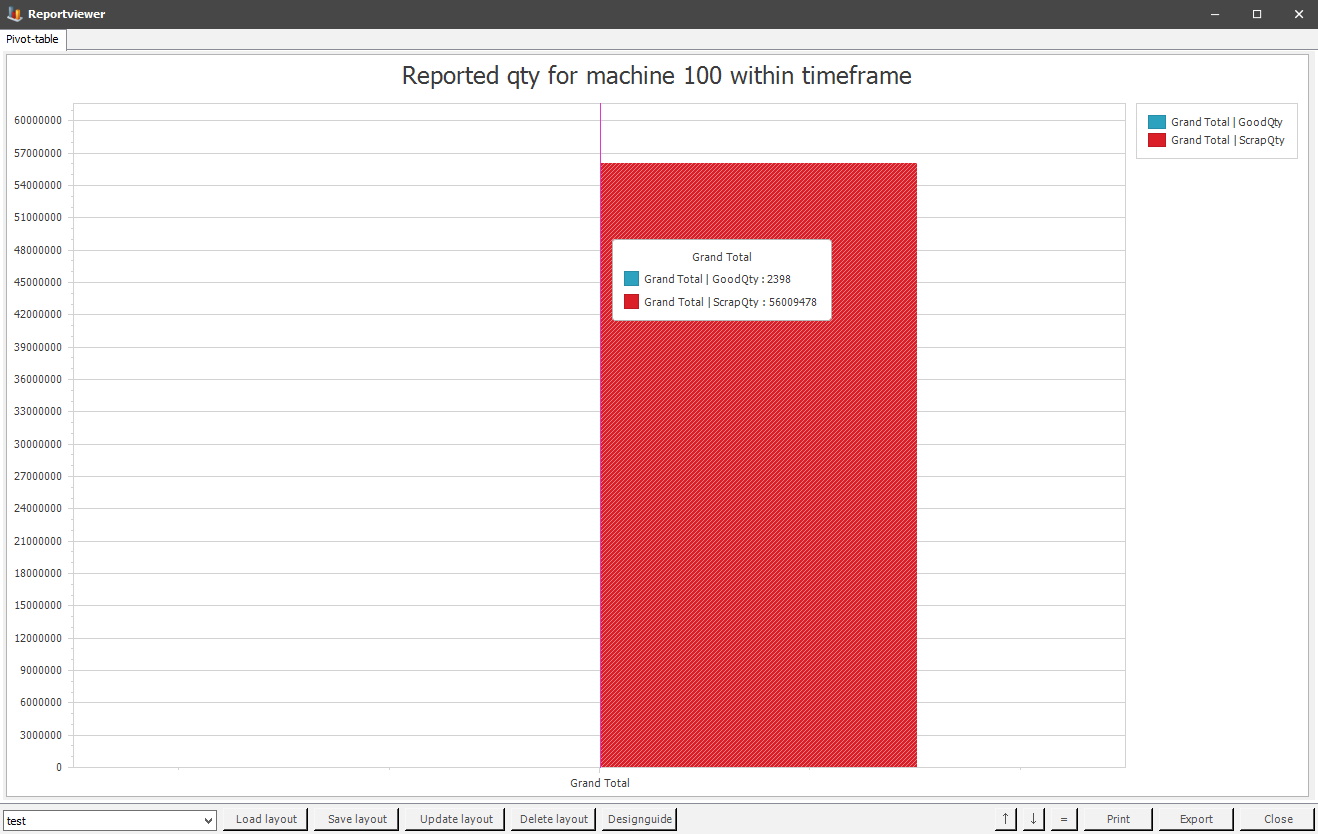
This function has separate documentation and you can find that via "Client" -> "Administration" -> "Basic data" -> "SQL qeuries". You can find a direct link here. The graphs will open in a separate program called "The report viewer" and you can find more information about that program here. Here there is more information about how tags works for own pivot/graph.
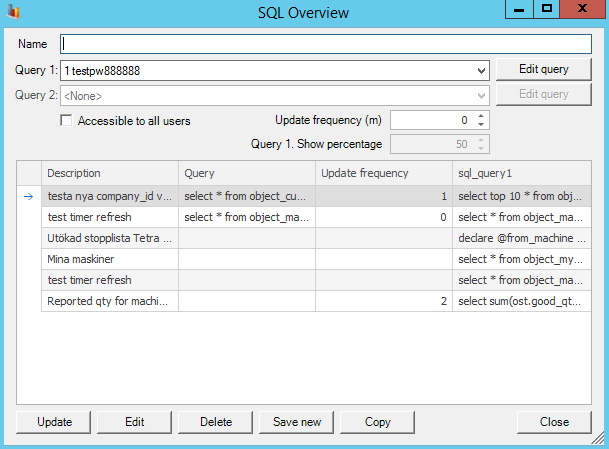
Please note that Query 2, as well as Query 1 Show percentage is not available in Own overview. They are only available in the Own pivot + graph. That is why they are grey in the picture above.
Name
Here you enter the name of the SQL Query you wish
to create.
Query 1
Here you can select 1 query to base the SQL
query on.
Accessible to all users
Here you can control the accessability to the SQL
Query. If this checkbox is activated, it will be available to all users. If this
checkbox is not activated, then only the creator of the SQL Query will have
access to it.
Update frequency (m)
This
will decide how often the SQL query will be updated, in minutes. For example if
you enter a value of 10 here, then every 10 minutes the SQL query will be
updated.