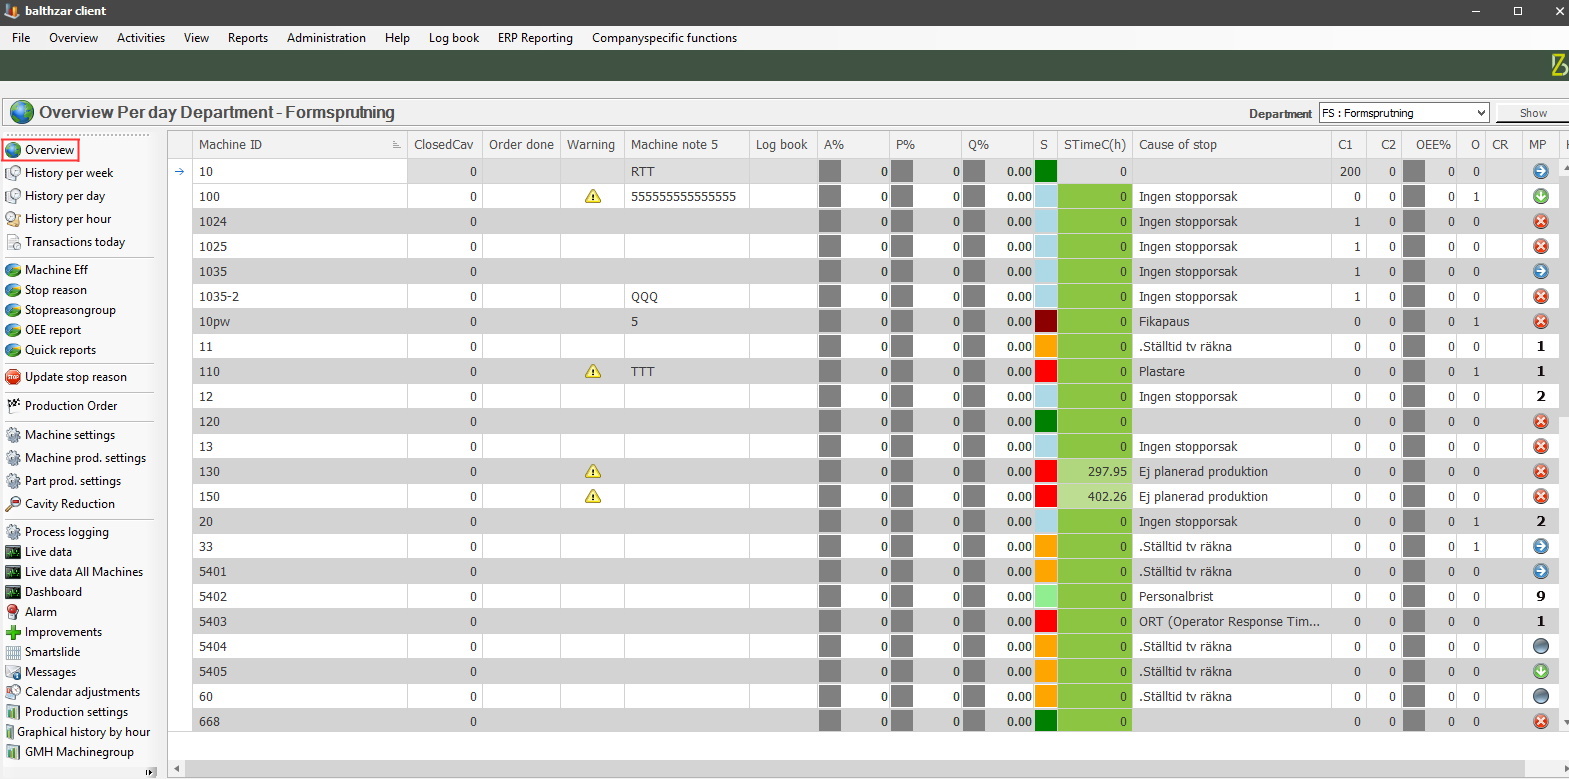
The idea behind the menu option "Overview" in Balthzar Clients left side menu is, as the name implies, to give the user an overview of available machines, their data, departments and so on. It also works as a short cut if you are on one of the sub menus, then just click on the "Overview" icon to return to it.
It is possible to change an Overview via "Client" -> "Main menu" -> "Overview" which has separate documentation.
The "Overview" in "Client" is customizable, and to activate it right-click on a column header, then choose "Column chooser". Once that is done a new menu will appear in the bottom right corner where more options will be available to further customize the "Overview".
It is also possible to add the special function "232 - 236 machine note 1-5" via "Client" -> "Administration" -> "System settings", "eTouch" -> "Special functions by machine". In that list select the machine/s that should have machine notes and activate it. Below there will be more information regarding what each column does.
Machine ID
Displays
Machine ID. This is entered in the field Machine ID in
"Client" -> "Administration" - "System settings" -> "Basic data"
-> "Machines" -> "Machine parameters 1".
ClosedCav
Displays closed cavities.
Order done
Data seen
here will show when the work order is intended to be finished. Only active work
orders can be visible here. If the machine is not active, and/or, does not produce anything, then this
column is empty.
Warning
In this column a yellow triangle
can appear. This symbol is a warning that indicates that the machine
does not receive any data. if this happens contact the system admin, or Delacroys support for
further help/assistance.
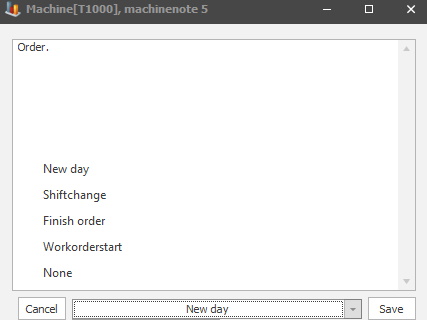
Machine
notes
From version
22.5.0 this is now standard functionality. Now
it is possible to use machine notes in the Overview in the Client without the
special functions 232-236. Here
is more information on how they work. In the notes users
can add extra information about the machine.
The drop-down menu can be used to reset whatever information entered here. For example, if a note is done about a specific order, then the options for work order start, or work order finish can be used to reset the note.
This will also be standard functionality in eTouch, and have its own menu in the eTouch main menu. Here is more information on how it works in eTouch.
Log book
Here you will be able to see more information
from the log book if such settings are done.
A% P% Q%
Depending on what settings the user has done
in tools -> options -> basic data -> users -> "Overview" ("Per day",
"Per shift", "Per 24h" or "Calendar") A%, P% and K% will display different
sets of data at the same time.
Each column has a square next to its value. This square will be red if the corresponding value = < entered Yellow limit in %, yellow if value > entered Yellow limit in % but < entered Green limit in % and finally green if value = > entered Green limit in %. Go to "Client" -> "Administration" -> "System settings" -> "Basic data" -> "Machines" -> "Machine parameters 1" to enter the information for this.
A%
Availability in precent
for selected part.
P%
Production in % for selected part.
Q%
Quality in % for selected part.
It is especially important to remember that when you calculate P%, it is done for the entire day, but its tool tip will display information that says it is only done for now active order. The consequence of this is that if you have completed two orders the same day and the first order has an extremely low value, it will have a negative impact on the P% total value. If the second order had an extreme high value, it will have a positive impact on the P% total value. If you move the mouse cursor to the square displaying P% you can see planned and actual speed. If for example the planned and actual speed would be 50/50 you could think that A% must be 100% however that is not the case because these numbers only show the current active orders status.
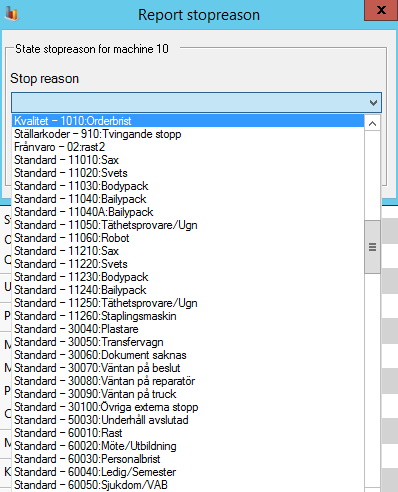
S (Status)
Status is
connected to a stop reason, and will be visualized through colors. This can
be created/edited via "Client" -> "Administration" -> "System settings"
-> "Basic data" -> "Stop reason" -> "Stop reason 1". Here is more
information on how this works. To change a stop reason in the Overview, click
on the color icon, and you will see a list
of available stop reasons.
STimeC(h) (Stop time in hours)
Time in
hours for current stop reason.
Cause of stop
Here you will see a description of the current
stop reason.
C1/C2
Number of cycles entered in counter 1 or
2.
EE%
Here you can see a summary for Equipment
Efficiency % (EE%).
O
Number of orders currently active.
CR
Number of cavity reductions. < /FONT
>
< /SPAN > < /P
>
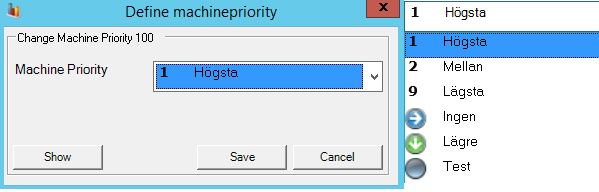
MP
Here you can see what current priority level each
machine has, as well as change it. This should be done by system admin.
Right-click in the column for MP in the Overview in the Client to see the
menu below. To activate this column, go to "Client" -> "Administration" ->
"System settings" -> "Basic data" -> "Users" -> "Machine
priority". Here
is more information on how this
works.