If the user has admin rights they are allowed to create new dashboard objects. To do this you need to go the left side menu in the "Client" then go to the menu for "Dashboard", and in there you choose the menu called "Edit".
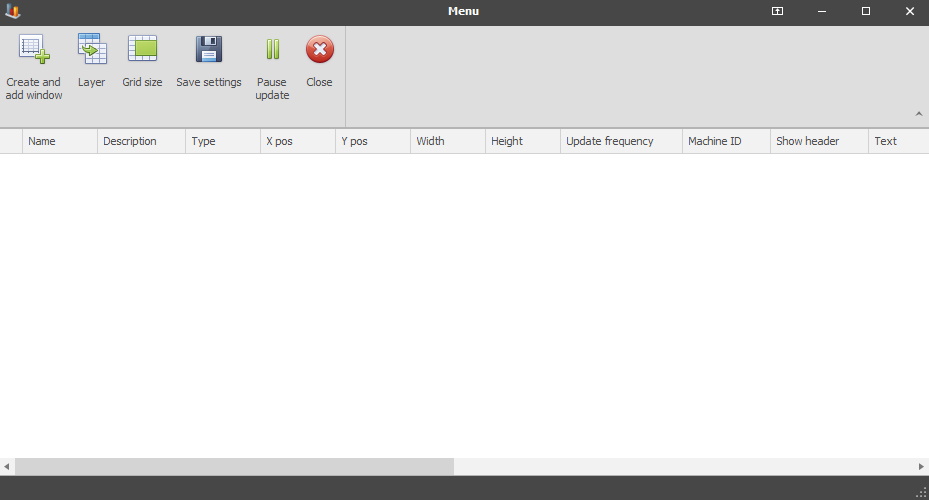
In the "Edit" menu you have to select a specific dashboard from the list of available dashboards and then click "Edit" and then click "Show dashboard". When the dashboard you have selected is active you can then use the shortcut "Ctrl + M" to gain access to the dashboards main menu. Here you will have several options as seen in the picture below.
If the button "Create and add window" is pressed a new window called "Object adder" is opened. See the picture below.
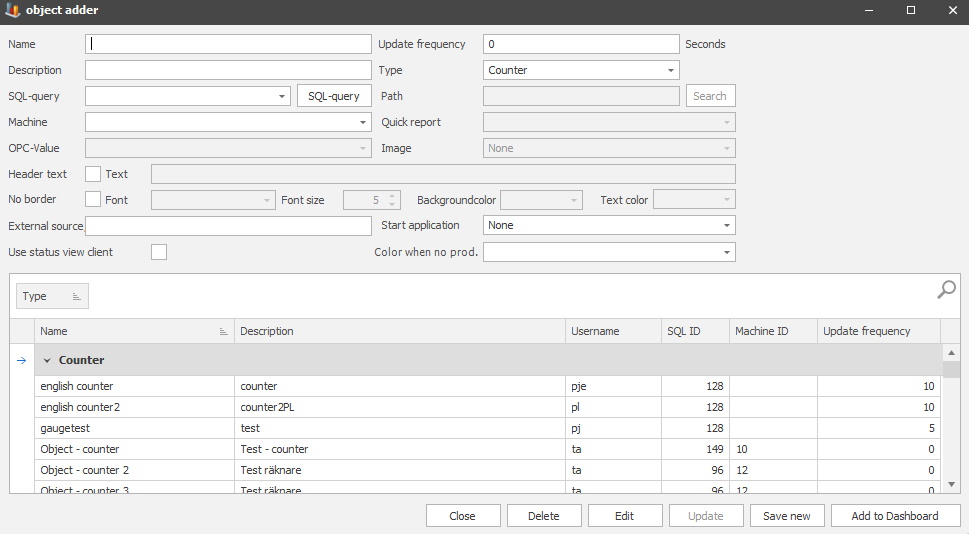
As you can see above the menu has a number of different options and they will be explained below. However, not all of the menu options might be available to choose from because it is the type of object you choose which determines what menu options are available. Each object type and application type has separate documentation.
Name
Here
you will enter the name of the Dashboard.
Description
Here you can enter a description of
what the dashboard does.
SQL-query
Here you can
select an SQL-query if the object type supports it or if you prefer you can
create your own SQL-query if you click the button "SQL-Query" and you can read
more about how that works here
.
Machine
Here you select the machine you
wish to use for the selected
object.
OPC
Value
Here you can select an image to show with youre object in the
Dashboard if you have selected the type "OPC Counter" or "OPC Gauge".
Update
frequency
Here you can select how often queries should be asked
of the database to fetch data, this is done in seconds. It is not
recommended to put a small amount of time here or ignore it completely. Because
the system will leave it at 0 as standard and then the query will only be asked
once.
Type
Here you can select what kind of type the object
you wish to add to the Dashboard should be. Each object type has its
own documentation.
Path
If the object supports it you can search the
local computer or the network for a document to add to the object
here. Might for example be a picture to a PDF Viever object or a report to
an Excel object.
Quick report
If the object supports quick
reports you can assign one here.
Image
Here you can select an image
if the object type supports it, like for example the object type "Image". In
order for the image to appear in this drop-down menu you have to add it to Balthzars file
system first. This is done via "Client" -> "Administration" -> "Basic
data" -> "Files" -> "Files" and you can read more about how that works here
.
Header text
This tick box will determine if
the object in the Dashboard will have a header text
or not.
No border
This tick box will determine
if the object in the Dashbaord will have a border around it
or not.
Text
If you activate the "Header text"
functionality you can enter a text here which will then be shown on the
object in
the Dashboard.
Font
Here you select the text font
for the
"Header text".
Font size
Here you select the size for
the
chosen text font.
Background
color
Here you can select a background color for the
object.
Text
color
Here you can select what color the text should
have.
External
source
Here you can enter information about an external source,
for example, a webpage address.
Start application
Here you
can choose which application, if any, you wish to use together with the
object. Each application has its own documentation. You can read more about
"Uncoded stops" here and
more about "Code current stop" here
.
Use
status view Client
Here you
can choose to see the "Overview" from "Client" in the object you create for the Dashboard. It
is also possible to use Balthzars grid system to customize what you
see here via the "Column choser". This section has its own
documentation and you can read more about it here
.
Color when no production
In this drop-down menu, you will select a color
that will then activate the function "Color when no production". This will then change
the Dashboard object's background color. The reason for this is to show viewers
of the Dashboard that this object's selected machine is not running and that
the object has a stop reason without the flag prod time and / or shift code
0. As of right now, you can choose between the two objects "Machine status" and
"Own value". You also have to assign an active machine to each
object.
You can read more about the object "Machine status" here and more about the object
"Own value" here
.
Please note that the Dashboard will be under constant development and new objects/features will be added over time. If you need any further assistance regarding any specific part of the Dashboard please contact Delacroy. You can find contact information for our support here .
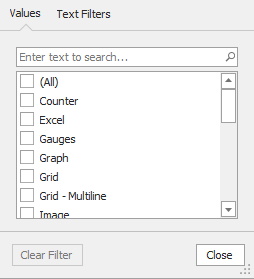
After some time there might be a lot of different object's added to the "Object adder". Therefore it might be easier to find each object if you search for the object rather than scroll down the list to find the object. You can either use the magnifying glass and enter a free text to search for something if you knew the objects name. Or you can click on the "Type" button and use the search filter if you wish to search for a certain type of object's. See the pictures below.