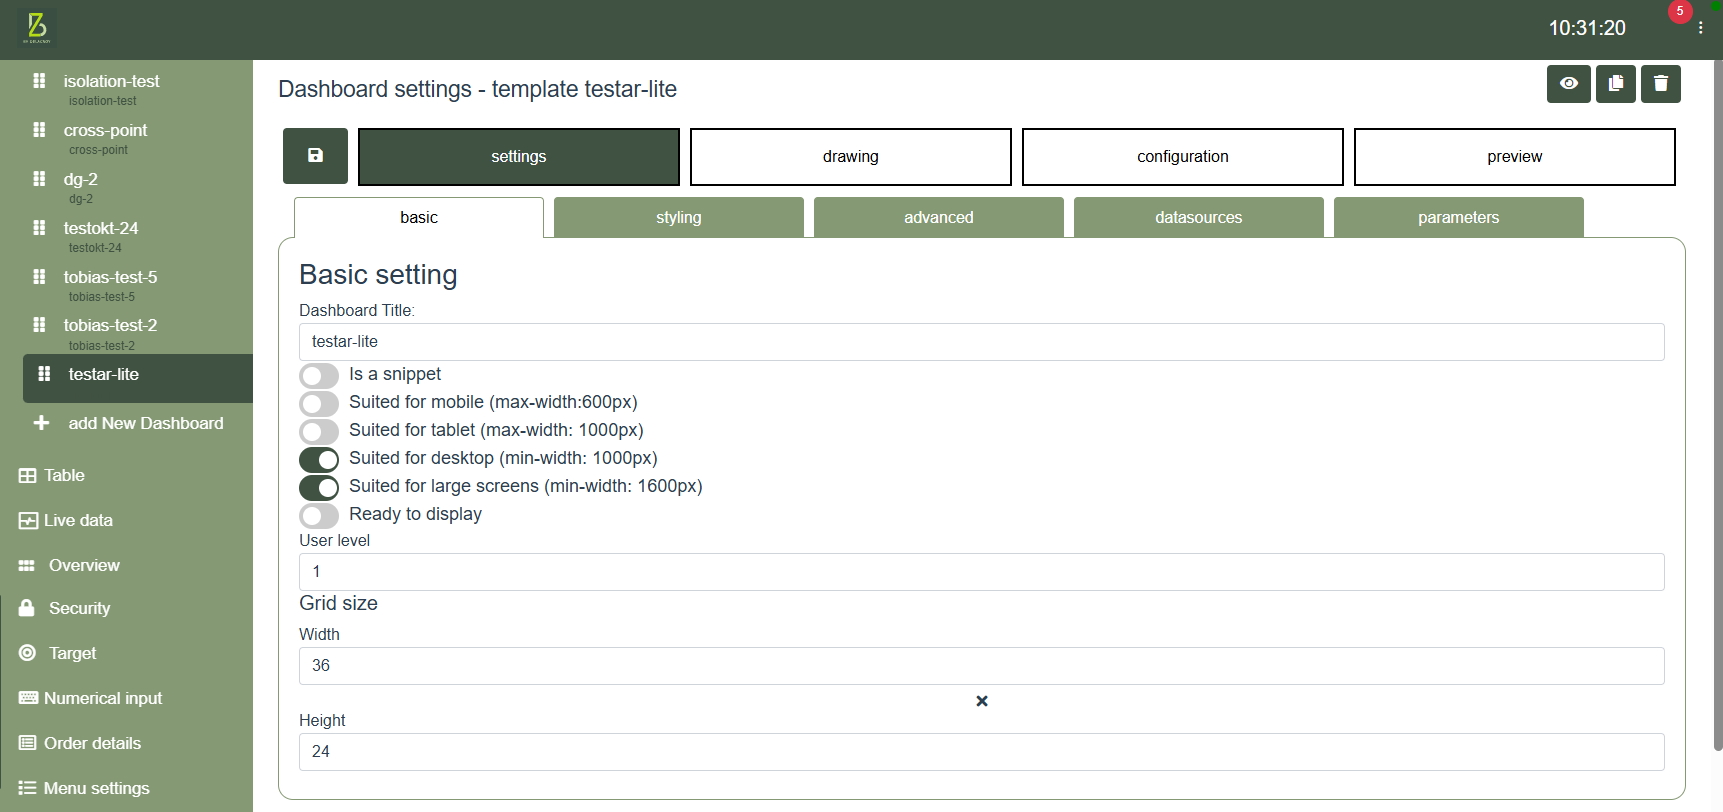
It is possible to see / create / edit dashboards in the web application BZX21. To view a dashboard go to the main menu to the left in the interafce, then use the option called "Dashboard". It is here that all avaialble dashboards will be visible in a list. To edit / create a dashboard go to the top right corner of the interface in BZX21. There is a menu there, go to the option called "Admin settings". It is in that menu that it is possible to use the add new dashboard menu. See an example of the dashboard settings seen below. For additional help / information about dashboards it is recommended to contact Delacroys support.
From version 26.1.0 there are several changes to how graphs are used / seen in dashboards. It is possible to select a color for staples in a graph, the vertical scales min / max values can be adjusted with standard values that can change over time, also changes are made to labels for horisontal stapels, they can now be longer / have more signs on it. Finally each dataset can now be assigned a stack group, datasets that draws bar charts can have the same stack group, and they will be stacked in the chart.
To edit/create a dashboard, go to the Overview in the Client. Select a machine, then in the left side menu, click on the menu called Dashboard. That menu will also show a list of any/all available Dashboards.
Please note that if a user has several accounts due to the use of different languages, for example one account for English, and one account for Swedish. Then it is important to know that the user has to create one Dashboard for each account to gain complete admin rights.
For example, one Dashboard for the English one, and one Dashboard for the Swedish one. if the user tries to change anything in the Dashboard with the English user, in the Dashboard created by the Swedish user, then that will not work.
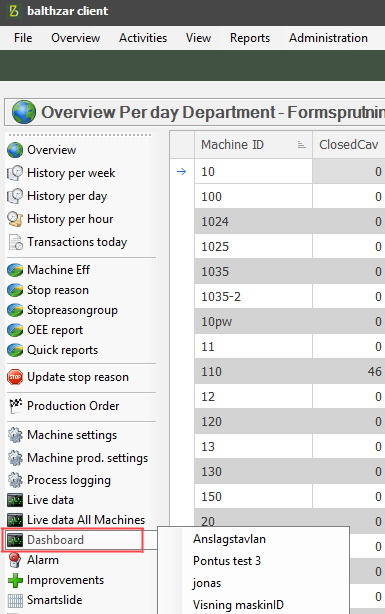
To make it easier to find the information you are looking for, each section for the Dashboard documentation has its own documentation. Follow the links below.
Edit dashboard
Create dashboard objects
Layers
Grid
size
Use status
view Client
Object - Counter
Object - Excel
Object - Gauge
Object - Graph
Object - Grid
Object - Grid - multiline
Object - Image
Object - Image from SQL
Object - Live data
Object - Machine status
Object - Machine status
picture
Object - Moving text
Object - Multiple gauge
Object - OPC Counter
Object - OPC Gauge
Object - Overview
Object - Own value
Object - PDF Viewer
Object - Quick reports
Object - Text
Object - Text from SQL
Object - Website
Application - Uncoded
stops
Application - Code
current stop